Securing a web application is crucial these days. When it comes to web developers, fixing the vulnerabilities should start from the first floor; from the developer himself. You, as a simple developer, do not really need to know all the hustle and bustle of pen testing. There are several good tools for scanning web applications. I will show you one of the easiest ways to run a web penetration with the tool OWASP ZAP (Zed Attack Proxy).

What is OWASP ZAP?

OWASP (Open Web Application Security Project) is worldwide non-profit organization focused on improving the security of software.

img

OWASP ZAP (Zed Attack Proxy) is one of the world’s most popular security tools. It’s a part of the OWASP community, which means it’s totally free.

Why did I choose OWASP ZAP?

It is designed to be used by people with a wide range of security experience and as such is ideal for developers and functional testers who are new to penetration testing.

ZAP is cross-platform. What it does is create a proxy between the client and your website. While you navigate through all the features of your website, it captures all actions. Then, it attacks your website with the known techniques. The good part is;

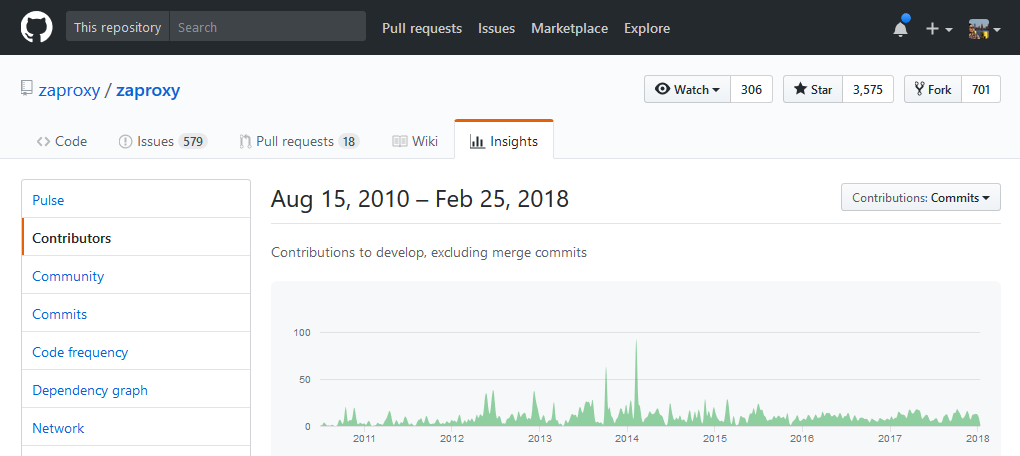
Yeap, it’s open-source!

At the time I visited their repository, the last commit was 40 minutes ago. It’s a very active repository. The project was initiated in 2010 and is still being improved. See the GitHub repository https://github.com/zaproxy/zaproxy.

img

Image1: GitHub Repository of Owasp Zap

Setting up your ZAP Environment

Starting OWASP ZAP

After you install the application to the default directory, you can start clicking the OWASP ZAP icon on your Windows desktop. The default install directory;

C:\Program Files\OWASP\Zed Attack Proxy\ZAP.exe

As it is a Java application, alternatively, you can run the following command to start it. It gives you extra configuration, like scheduling your penetration test or starting with a particular URL. This is how you do it;

java -Xmx512m -jar zap-2.7.0.jar

When you run the app, it asks you whether you want to save the session or not. If you want to reach your website configuration or test results later, you should save the session for later. For now, let’s keep it default “No,I do not want to persist the session”

Image 2: Default Startup Dialog of Owasp Zap

What Is the Difference Between Active & Passive Scan?

What is a passive scan?

In terms of penetration tests, a passive scan is a harmless test that looks only for the responses and checks them against known vulnerabilities. Passive scan doesn’t modify your website data. So it’s really safe for the websites that we don’t have permission. As you know, OWASP's number 1 vulnerability in 2018 is still Injection. And be aware that you can not detect even an SQL Injection with a passive scan.

What is an active scan?

Active scan attacks the website using known techniques to find vulnerabilities. Active scan does modify data and can insert malicious scripts into the website. So when you really test your website against security issues, deploy it to a new environment and run the active scan. And only run the active scan for the sites you have permission!

img

Active Scan

Introduction to ZAP UI

Let’s have a brief look at the ZAP UI layout to understand the basics. On the following screen, I enumerated windows with four sections.

img

Image 3: Owasp Zap UI Features

1 — Modes : On the upper-left of the screen, you see modes. There are four modes;

  • Standard Mode: Allows you to do anything to any website.
  • Attack Mode: Active scans any websites.
  • Safe Mode: Turns off all the harmful features while scanning.
  • Protected Mode: Allows you to scan websites in a particular scope. It prevents you from scanning an unwanted website

2 — Sites: All the sites you access via the ZAP Proxy will be listed here. If your website makes a request to another website, you’ll see that under a separate site.

2.1 — Show Only URLs in Scope: You should toggle this option on because the section of the site gets ugly after some testing. To focus your target website on the sites, you should create a new context for your website and keep In Scope option checked. By doing this, you will no longer see other websites that you are not interested in.

img

Image 4

3 — Workspace Window: The workspace window consists of 3 tabs:

3.1 — Quick Start Window: It’s the direct and fastest way of starting an active scan. Enter the target website address in the URL to attack input and hit the attack button. It first crawls the website and then performs the active scan.

3.2 — Request & Response Window: These are the most used parts of the UI. In the request tab, you see the window is divided into two parts. The upper shows request’s header and cookies, and the bottom shows the post parameters as being sent to the server. The response window is similar to the request window. Shows the response header and body.

img

Image 5: An example for request & response

4 — Bottom Window: It shows the results, the request history and the vulnerabilities of the test. The most important tab here is the Alerts tab.

4.1 — Alerts Tab: It shows the vulnerabilities found on the target website. When you click one of the alerts in list (1), it opens the related request/response on the right-upper (2) and gives neat information about the vulnerability.

Let’s see what happened on the -Image 5- request tab;

A POST request is made to http://localhost:22742/api/TokenAuth/Authenticate. So a user is signing in with credentials. The server returns HTTP-500 error.

HTTP-500 Internal Server Error. 

OWASP ZAP thinks it’s a problem. And on the 3rd window, you see some information about this problem. It shows the exact URL and a yellow flag (medium risk). The description says

This page contains an error/warning message that may disclose sensitive information, like the location of the file that produced the unhandled exception. This information can be used to launch further attacks against the web application. The alert could be a false positive if the error message is found inside a documentation page.

This is cool because OWASP ZAP smells some information leak. It suspects the website throws an unhandled exception. This can be really vulnerable when a website shows some exception stack to the attacker and gives info about the environment or code. But here, in our example, the response is JSON content that says “Invalid user name or password” but the developer prefers to send it via HTTP-500. It is a false-positive alert because no information is being exposed.

img

Image 6: Asp.Net Yellow Error Page Exposes Information

The solution section gives information about how to overcome the issue.

Review the source code of this page. Implement custom error pages. Consider implementing a mechanism to provide a unique error reference/identifier to the client (browser) while logging the details on the server side and not exposing them to the user.

img

Image 7: Alert Window

Proxying Your Website: JxBrowser

In the earlier version of OWASP ZAP, you had to configure your browser’s proxy to capture requests. But there’s a new cool feature JxBrowser! This is a Chromium-based browser integrated in OWASP ZAP. By default, it has all the proxy configurations set up and lets OWASP ZAP cross all the traffic over it. Hit the Launch Browser and navigate to your website.

img

Image 8: Start JxBrowser

Navigating Your Website

In order to extract the tree of your website, you need to crawl the website in JxBrowser. You should hit all the features go thru all possible actions. This phase is very important!

> The more you explore your website, the more you get efficient results.

Navigate your website

Spidering Your Website

Spidering a website means crawling all the links and getting the structure of the website.

Why do we need spidering?

If you access all aspects of the site while navigating your website, then strictly seeking, you don't need to use the spider — that's there to pick on things you missed or when proxying isn't an option.

This is done by right-clicking of the site and selecting Attack from the menu, then clicking Spider. Be sure recurse option is checked! Press the Start Scan button. It will take some time, according to the link counts on your website.

How do you pentest a SPA (Single Page Application) website?

If it’s a SPA website, then you need to tell ZAP more information, in particular that one, parameters represents application structure rather than application data. To do this:

  • Double click your Context (in our test, it’s a modern AspNet Zero SPA)
  • Select the ‘Structure’ tab
  • Add the ‘structural’ parameter(s)

img

Image 9: Spidering Your Website

If you cover all the features and actions of your SPA website, then you don’t need to spider!

Extensions

There’s an extension marketplace added by the community. You can click the -3 Colored Boxes- icon to show up the list. To install an extension, click on the Marketplace tab and write the extension name in the box. Then click the Install Selected button. That’s it! No need to restart.

There are useful extensions! Some of them I can suggest;

  • Active Scanner rules
  • Passive Scanner rules
  • FuzzDB

img

Image 10:Extensions window

Configure Scan Policy

Before scanning, I recommend setting a scan policy like the one shown below; From the Analyse menu, select Scan Policy Manager. Click the Modify button. In the Scan Policy window set Low => Threshold To All and click the Go button. Same as Insane => Strength To All and click Go button. And to save, click the OK button. This will go through all the attacks in memory and make the scan robust.

img

Start Attacking

Attacking the target website is very straightforward.

1 — Add your website to the Context. To do this, right-click the target website in the left pane. Choose Include in Context and select Default Context. You can create a new context as well. Now you see there comes a new website URL in the pop-up window, which adds your website as a regular expression. Asterix (*) in URL means attacking all the URLs under this website. Before attacking, you can go thru the other options in the Default Context to fine-tune your settings. Finally, we click OK button.

img

Image 11: Include Your Website In Context

2 — Show only the URLs in the current scope. By doing this, you hide the other websites, and you prevent accidental attacks.

Image 12: Show Only URLs in the Scope

3 — Run a spider scan to traverse all paths in the website.

img

Image 13: Start Spidering

4 —Attack! This is the main goal. We’ll start Active Scan. An active scan can insert harmful data into your database. So run it only on the allowed websites. When you click Start Scan, it’ll start progress, which can be time-consuming depending on the URL count.

img

Image 14: Start Active Scan

Up to here, we almost finished pentesting. It is are nice to have options you can do;

Fuzzer

Fuzzing is sending unexpected or random data to the inputs of a website. Normally, we validate inputs on client-side that’s why we ignore some problems in the back-end. When you fuzz key inputs (like a main search input of the website or the login page inputs), you can see coding errors and security loopholes. This is an optional security step. If you want to run Fuzzer, locate the request you want to fuzz from the left pane. Right-click and choose Attack, then click Fuzz. In the Fuzzer window, you’ll see the request post data. Click on the post data and highlight the text you want to attack. On the right pane, click the Add button. You’ll see the Payloads window. Click the Add button again. In the Add Payload window, choose File Fuzzers from the type combo box. Select the file you want to use. This file is a database that will be used to brute force the input. When it finishes, the results will be listed on the bottom tab called Fuzzer. The ones tagged with Fuzzed are suspicious and need to be taken care.

img

Image 15: Fuzzer

Forced Browse

The spider looks for known, organically linked URLs. However, the spider cannot find a URL that’s not mentioned anywhere on the website. In that case, forced browsing comes in. Forced Browsing uses brute force dictionaries to check if there are any other hidden URLs like an admin panel or something that can be hacked.

img

Image 16: Forced Browse

Break

The break is a very good function for intercepting and modifying the requests and responses. If you want to change any particular request post data or response data, right-click on the site, choose Break, in the Add Break Point window, and click Save. Now, on the bottom pane, you’ll see that breakpoint is enabled. From now on, all the requests will be intercepted by the OWASP ZAP tool. Whenever you make a request from the original website, the ZAP window will bring you to the front and allow you to modify the request. After you press the green play button on the toolbar, ZAP brings you the response sent by the server. And you can modify the response as well. So your browser will retrieve the altered response.

img

Image 17: Breakpoints

Results & Report

You have a good job here. Scanned your website for known vulnerabilities. But without reporting those issues properly, you are not complete.

Reporting vulnerabilities

You can see the issues on the Alerts tab that is located in the bottom pane. In the following screen, there are five alerts with colorized flags. If you have no red flag, then you are lucky! For those with red flags, first focus on them and fix them ASAP.

Image 18: The flag colors show the risk level.

If you don’t see any alert, then you might have done something wrong!

When you click one of the alerts, it shows the related request & response window. There’s a nice reporting tool that generates a neat report file automatically. You can export reports as HTML, XML, JSON, Markdown … I generated an HTML report. You can see it’s a well-organized final report that you can send to any fellow as is.

Image 19: Generating Report

img

Image 20: HTML Report

I hope you enjoyed the article! Secure coding ;)